Reusable components
You will have noticed how we often seem to repeat certain operations when constructing an analysis. For example, we have often applied a filter, "Requests"."Request Details"."Active Request Flag" = "Yes". We have constructed some complex column definitions by editing the column formula and then done the same again in a different analysis. The purpose of this chapter is to investigate to what extent we can code, store and reuse objects in OAS and the techniques for doing so.
Saved columns
We mentioned saved columns briefly in the chapter, in the context of editing complex bins definitions and how those definitions might be reused. We can now investigate this further. We’ll stay in the "Requests" subject area. The steps we are going to work through are as follows:
-
Develop a column definition and formula that we wish to have, we shall do this in the context of a simple analysis, "analysis_1".
-
Save, and name, the definition of our developed column definition, as we know it will be useful for other analyses in the "Requests" subject area.
-
Develop another analysis, "analysis_2", which uses the saved, named, column definition.
-
Edit the saved, named column definition independently of the two analyses and observe how the updated definition of the saved column is reflected in the results of the two analyses.
To save a column definition, select "Save Column As" as shown in Figure 1.
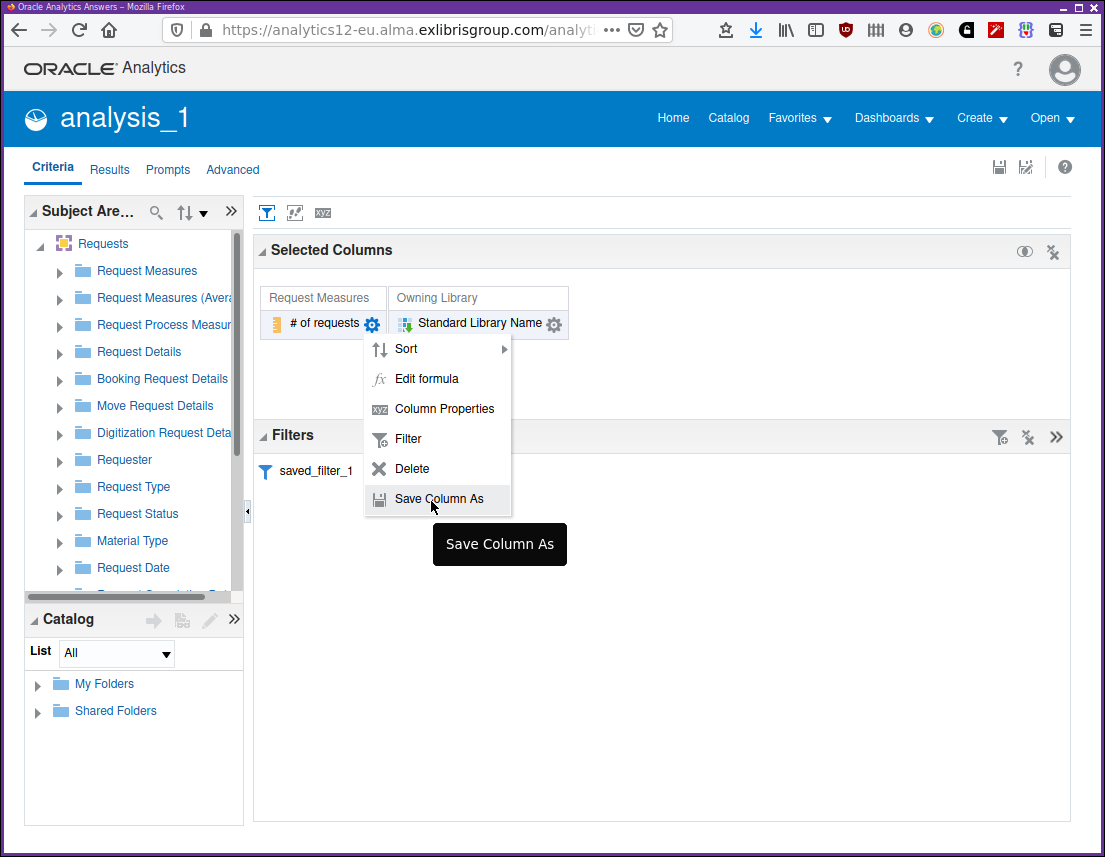
The save dialogue will prompt for a name for the saved column and a description. It will suggest a particular folder structure "My Folders/Subject Area Contents/<Subject Area Name>". This is a suitable logical arrangement and will make finding saved components for reuse a little easier. It will be better to save in your institutional shared folders if the saved components are to be used by other analytics developers.
Follow along in the video Creating and using a shared column definition as we construct, save, use in another analysis, and edit a saved column. Note in particular that changes made to the definition of the saved column will be reflected in all analyses that reference that shared column.
Filters
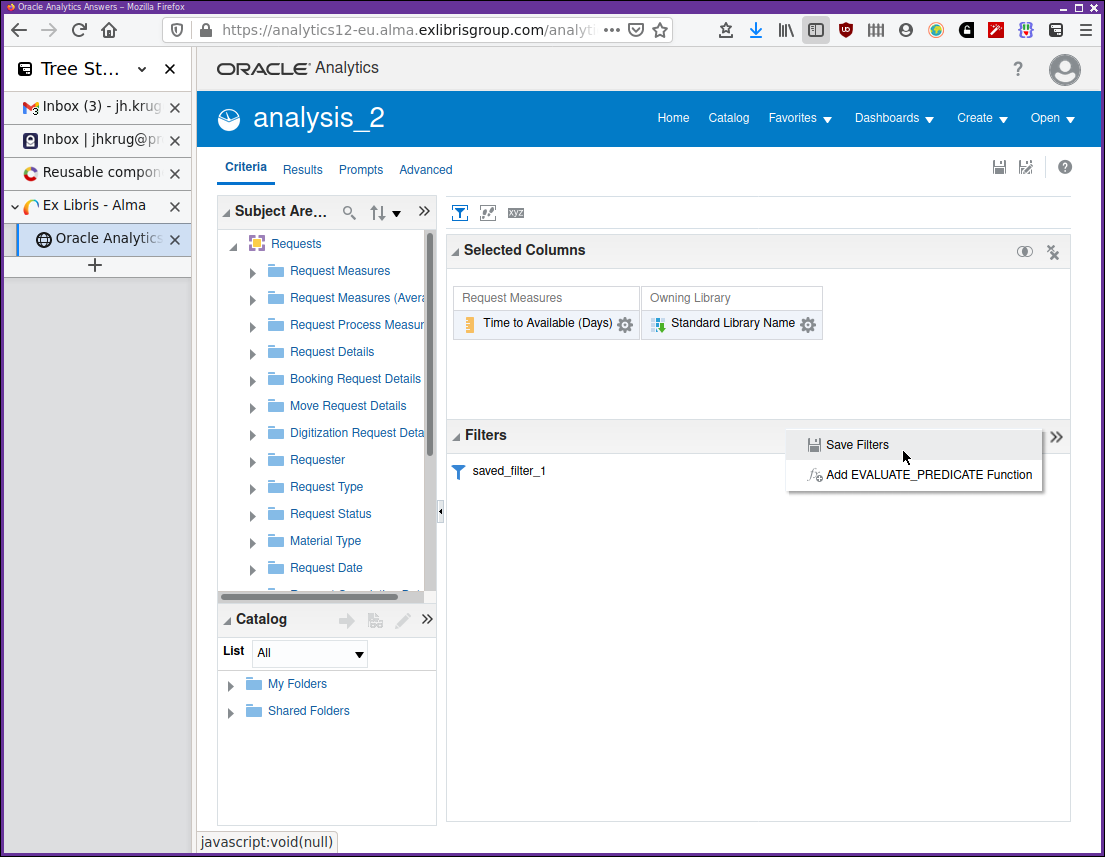
As we have seen with saved columns, something similar is possible with the filters we are using in our analyses. When we have developed a set of filters for an analysis, and we think they are useful for other analyses in that subject area then we can save the filters using the menu shown in Figure 2.
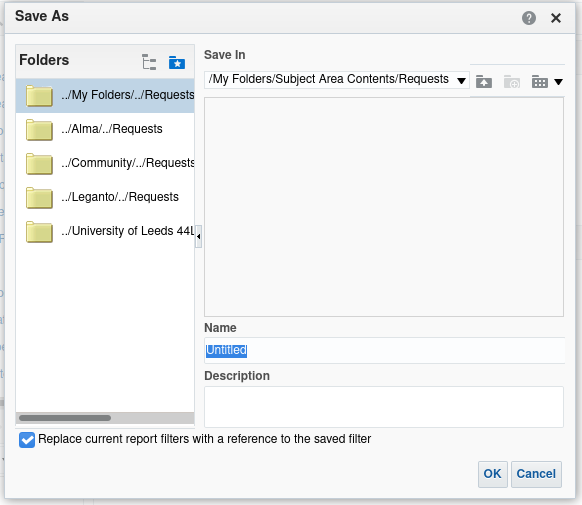
Selecting this brings up the dialogue shown in Figure 3. Note the option to have the filters in the current analysis replaced with a reference to the saved definition. This will usually be what you want to do.
The video Creating and using a saved filter integrates saving and using a filter with the analyses used in the section on saved columns above.
As well as being able to save filters from within an analysis, to create a saved filter, it’s also possible to create one using the "New" menu. This is fine though, at least initially, it may be better developing saved filters within the context of working on an analysis. It’s easier to see the effect of filters in an analysis results tab while developing the filter.
Prompts
We have worked with dashboard prompts before in the "Working with dashboards" chapter, so we know how to create a prompt for variables or column values to be used within a dashboard. That should have covered most things that we would like to know about saving and reusing prompts. We did not cover the creation of an image prompt so let us do that now.
Image prompts
| This section on image prompts is under review (2021-02-15) since the introduction of OAS in 2020. Currently, existing image maps do not appear to work and new image maps cannot be created. So, feel free to skip this section, and go straight to 'Actions' for the moment. |
These allow you to establish an image, and regions thereof, as being a prompt. So, for example, the prompt could present a click-able image map of countries, or of your institutions libraries, or a stack layout. These could then be used to filter for a place of publication, or a library location, or a stack location.
To demonstrate this we can use some library names from the University of Leeds. Consider the image in Figure 4 intended to represent a map of library locations.
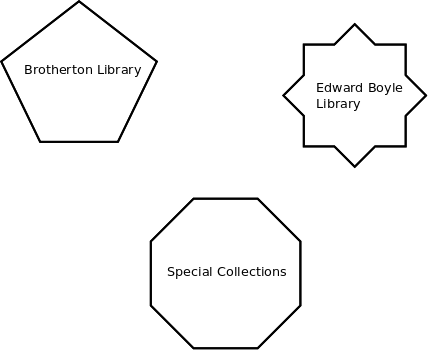
To be used by OAS it needs to be placed on a web-server somewhere and this image has been located at https://jhkrug.github.io/public/images/libtics-im-demo.png.
Open the folder "AAPL Training/reusable/". There are three catalogue objects we shall use for this demonstration. There is an analysis, "physical_items_for_image_map_demo", a dashboard prompt, "image_map_demo_prompt", and a dashboard encapsulating these two objects. The dashboard is "db_for_image_map_demo".
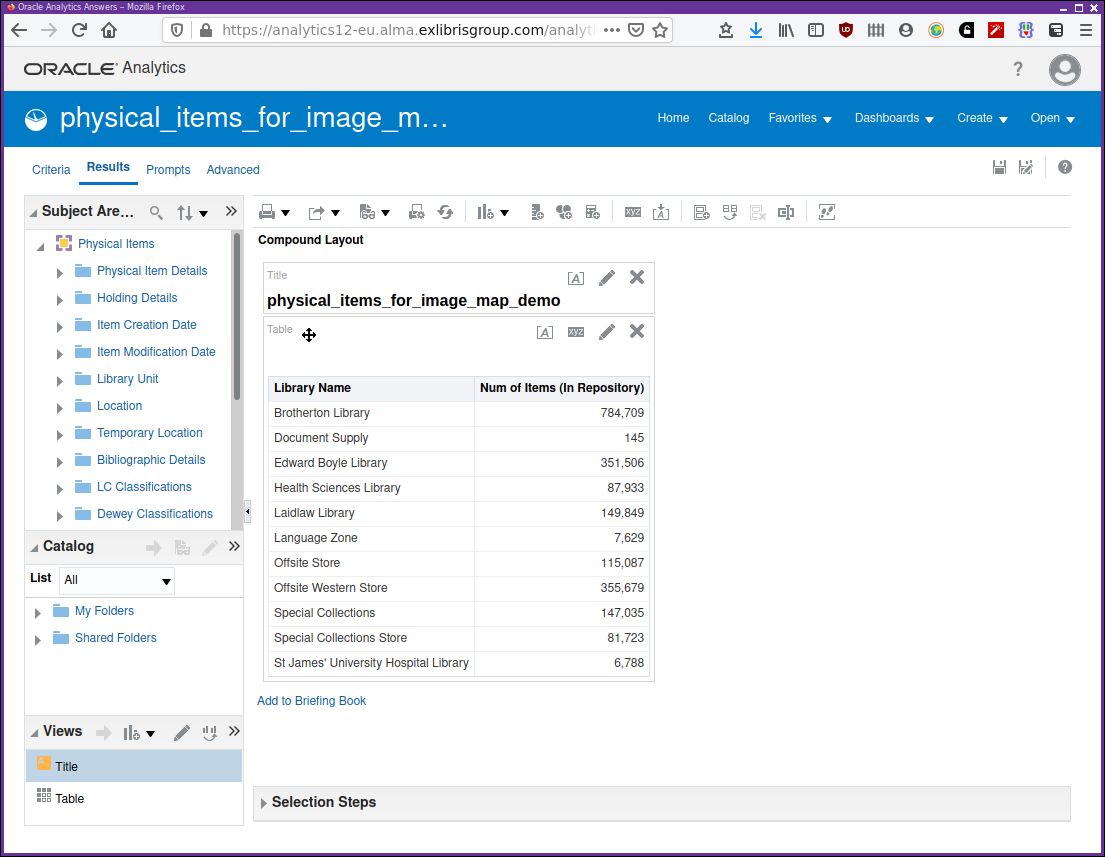
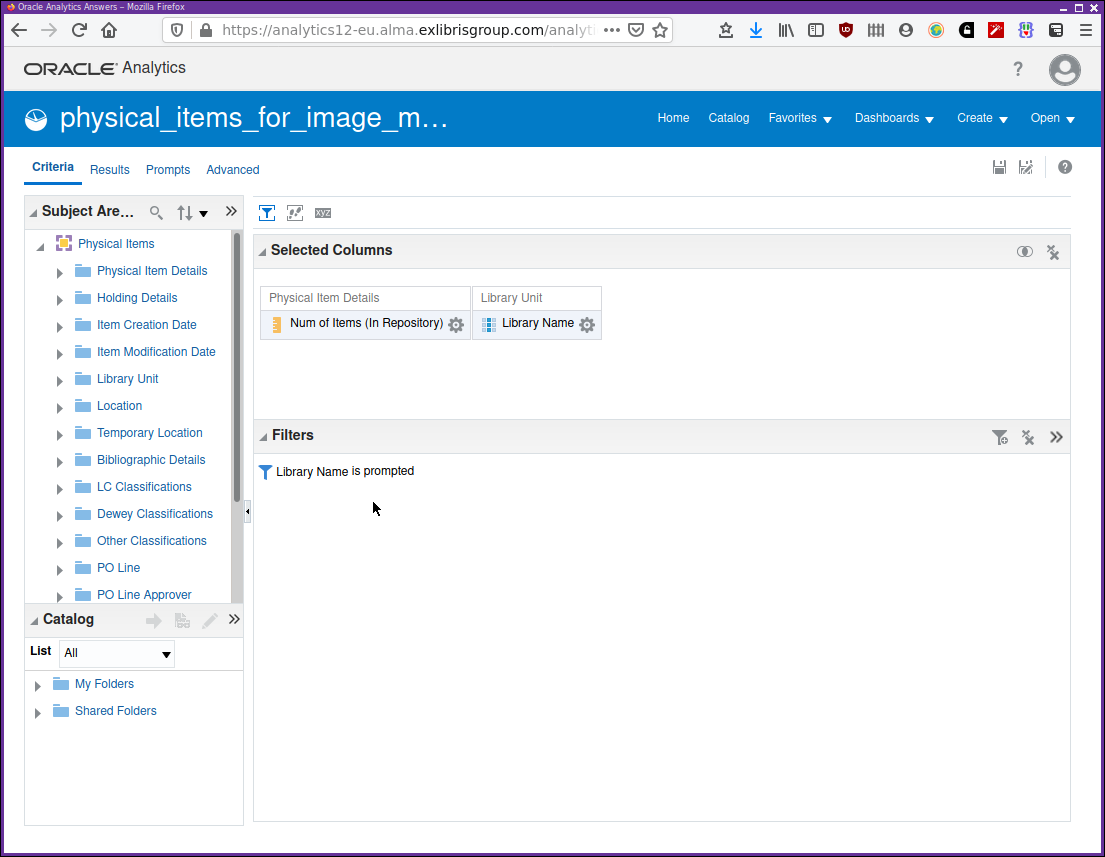
Open the analysis "physical_items_for_image_map_demo". The results tab, Figure 5, shows, by default, a list of defined libraries and the number of items at each. The criteria tab, Figure 6, shows the columns being used and that there is a filter in place "Is prompted" on the column "Physical Items"."Library Unit"."Library Name".
In order that OAS can use our image map, we will need a HTML image map definition to give to it. Shown below, is some abbreviated HTML code that defines a HTML image map for our image. There are any number of ways to build one of these image maps. For this demonstration, the tool at https://www.image-map.net/ has been used. It allows you to load up your chosen image to use as an image map, define the clickable areas, and produce the HTML image map code, as shown in HTML source for the image map.
<!-- Image Map Generated by http://www.image-map.net/ -->
<img src="libtics-im-demo.png" usemap="#libtics-demo-image-map">
<map name="libtics-demo-image-map">
  <area
    target=""
    alt="Brotherton Library"
    title="Brotherton Library"
    href=""
    coords="46,24,79,1, .... more coords .... 69,11,46"
    shape="poly">
  <area
    target=""
    alt="Edward Boyle Library"
    title="Edward Boyle Library"
    href=""
    coords="359,16, .... more coords .... 3,79,430,48,390,30"
    shape="poly">
  <area
    target=""
    alt="Special Collections"
    title="Special Collections"
    href=""
    coords="232,194, .... more coords .... 304,227,274,200"
    shape="poly">
</map>
This HTML source code will need to be pasted into the HTML image map source panel in the prompt creation editor dialogue in the "Design Analytics" editor. The process for creating a new dashboard image prompt is as follows:
-
From the main "Design Analytics" screen, .
-
New prompt from the prompt editor
 , selecting "Image Prompt" from the drop down
menu.
, selecting "Image Prompt" from the drop down
menu. -
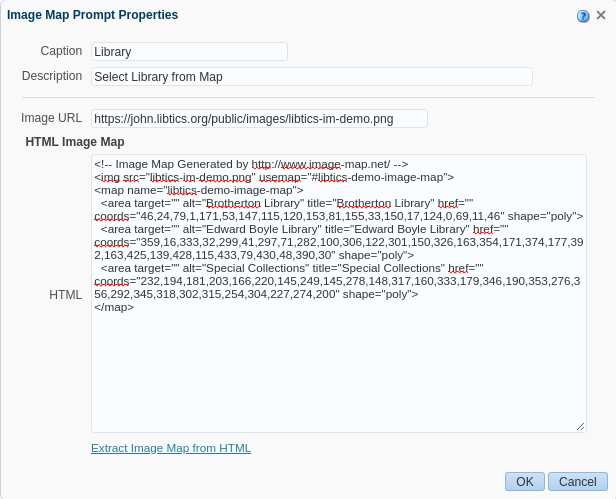
Fill in the fields in the dialogue. For our current example it should look as shown in Figure 7.
-
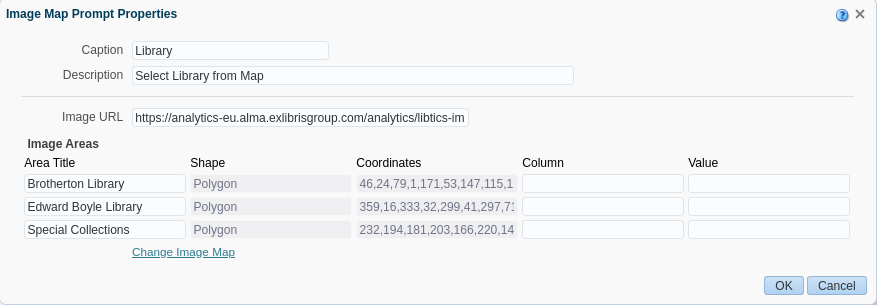
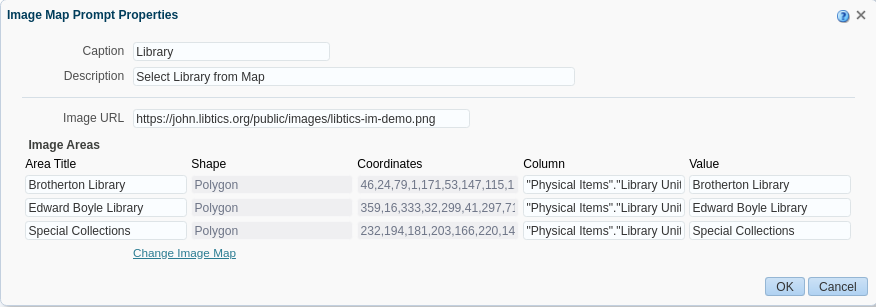
Click on "Extract Image Map from HTML" and the next dialogue, shown in Figure 8 is shown on the screen.
-
Now we can add the values to be used for "Column" and "Value". These are the OAS analysis columns and values that are to be used when each shape definition is clicked on in the image. For our example, the OAS column definition is "Physical Items"."Library Unit"."Library Name" along with an appropriate library name, that can be found in the data for that column. For our example the screen will now look as in Figure 9.
-
After clicking on "OK" the image prompt is now complete and the dashboard prompt editor should now look as in Figure 10.
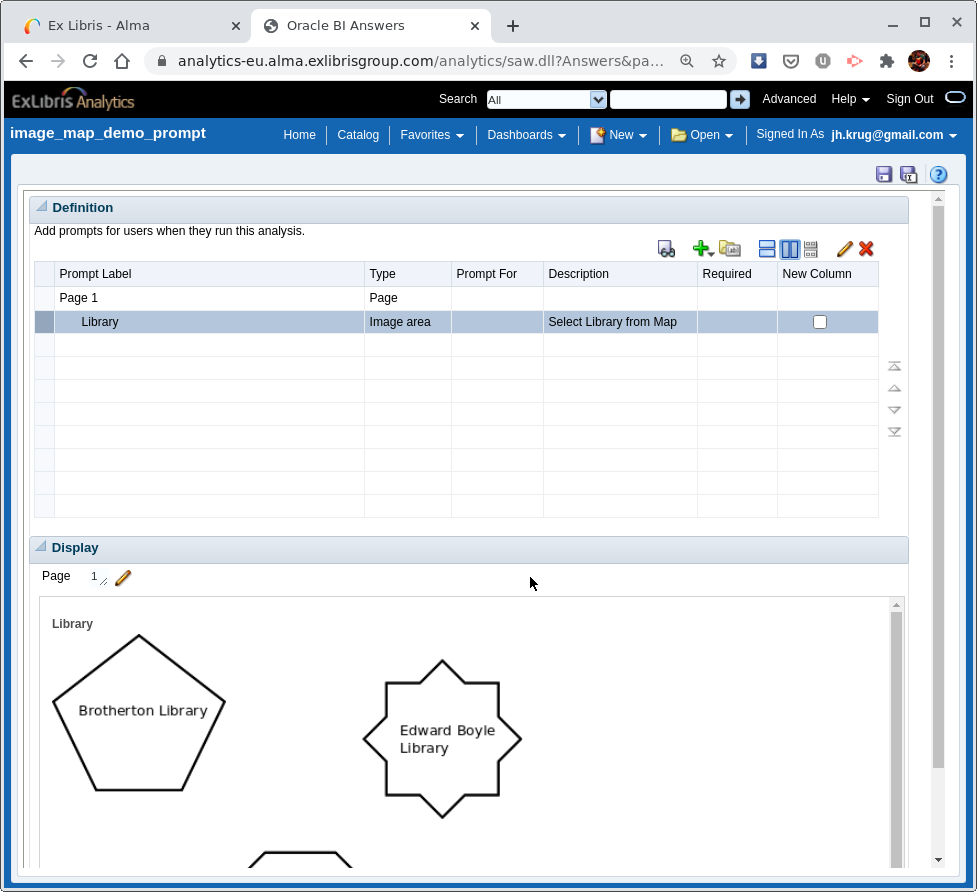
We are now ready to pull together our image dashboard prompt and the analysis into a dashboard. In the catalogue folder "AAPL Training/reusable" there is the dashboard definition "db_for_image_map_demo". Open this for edit. It has two parts in the layout editor, our dashboard image prompt "image_map_demo_prompt" and our analysis "physical_items_for_image_map_demo". Recall that the analysis is defined in its criteria tab to have a filter on "Library Name" that is defined as "Is prompted". Run the dashboard, notice that initially the results are unfiltered by library. Click on the image map to select one of the three libraries and note how the results display changes.
Conditions
These can be established for "Agents" to monitor. But in the absence of agents in the Ex Libris implementation they are of little use at the moment. They can be selected to be used as a condition for a panel display on a dashboard, but the author has not been able to make this work as expected. The dashboard, using a saved condition, when executed just returns an error message.
Actions
We have defined and used actions in "Analyses in more depth - Adding interactivity" and now we can consider their definition again.
If, from the "New" menu, "Action" is selected the user is prompted for the type of action to create as in Figure 11.
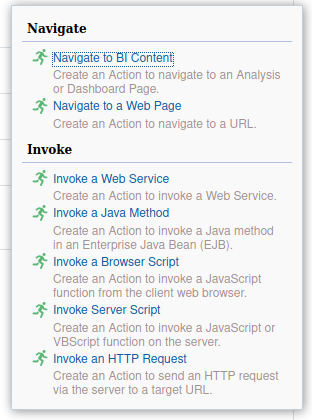
All of these allow the construction of an object which when invoked, populates any defined parameter fields and makes a call to the service described by the "Action".
-
Navigate to BI content — This loads another analysis into the current page or a new tab or window. This new analysis can accept parameters using the "Is prompted" filter. Useful for drill down operations.
-
Navigate to a web page — loads a web page, optionally in a different tab or window. It’s possible to pass parameters such as MMS ID as we have seen using the example of making a request in the institutional Primo catalogue.
-
Invoke ….. — You may have application servers used by your institution that can provide this type of service. This might be useful for making a call to a billing system or a student/staff registry system. This could be to retrieve data for display or to update other systems with data derived from analytics. All the "Invoke" options are providing more or less the same sort of service, but using different technologies.
After creation, definition, and saving these "Actions" will be available to choose in the catalogue for use within analyses. Instead of creating a new action, one is selected from the catalogue using the appropriate menu option.
Agents
These do not appear to be available in the current Ex Libris implementation However, if they were, it would be possible to establish agents to monitor "Conditions" and to invoke alerts or actions.
Reusable components — final points
We have seen how it is possible to build a "library" or collection of reusable objects, particularly saved columns, filters and actions, that can be used by different analyses at your institution, and perhaps shared with others. They can be crafted to provide custom facilities such as helping process a custom classification scheme. The intent would be that improvements and changes over time can be made in one place and then used in multiple contexts. This saves effort, increases reliability and consistency, and improves maintainability.
Exercises
-
We have taken a look, to a lesser or greater extent at most of the useful functional facilities provided by APL analytics. Considering the functional area in which you work perhaps now is a good moment to consider how an analytics dashboard might look for your domain. What analyses would be useful to you. Sketch out how they might look on an analytics dashboard.