Working with dashboards
Dashboards are the primary mechanism by which an analysis or collection of analyses can be presented to a user of analytics. A dashboard can have multiple tabs and each tab can contain one or more analyses.
You may wish to take a look back at dashboards in Using Analytics — Part 2 where the mechanisms for making dashboards available to your analytics consumers are covered.
Analyses are selected from the "Catalog" panel on the left and drag-dropped into place. Components of various types, complementary to analyses, can be added to a dashboard. They are available from the "Dashboard Objects" picker on the left of the screen. Like analyses, they can be dragged and dropped into place into the layout panel. The layout editor is shown in Figure 1. These techniques are covered in Dashboard layout.
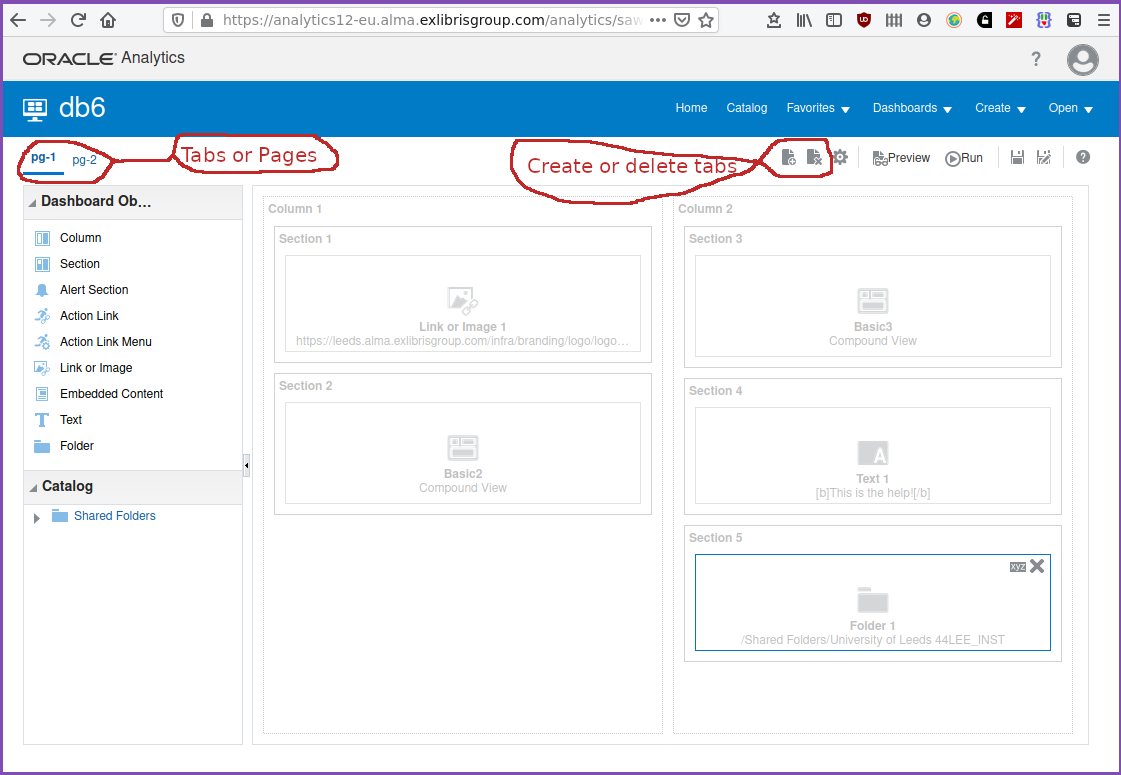
In Figure 1 two tabs pages are shown, "page 1" is present
by default and "p2" was added. The icons  and
and  are used to create and delete tab pages.
Once components are in the layout panel they can be re-arranged by drag and drop. Although there is an "Alert Section" available, it doesn’t seem to provide anything. Alerts are generated from "Agents" which do not currently appear to be available in the Ex Libris implementation of OAS.
We shall take a look at:
-
Dashboard layout
-
Using variables in dashboard components
Materials for this chapter can be found in the "AAPL Training/dashboards" folder.
Dashboard layout
This is all very straightforward. You need to drag and drop components from the "Dashboard Objects" list and analyses from the "Catalog" into place. Each added component will have some buttons or menus that will appear in the top right of the component screen space when the mouse hovers over that component. These can be used to adjust options or formatting.
Note, in particular, where a "Condition" item appears in a menu. This allows you to specify a condition which, when evaluating to "TRUE" will show the component in the running dashboard. If "FALSE" then the component is not displayed. So, for example, a dashboard component could be configured to display the analysis it contains only if that analysis returns a number of data rows greater than 0.
The video, Dashboard layout, shows the process of creating and editing a dashboard, placing two analyses onto the first page, and another analysis on a second page, along with additional components.
| "Link or Image" and "embedded content" dashboard layout sections no longer appear to be working with the new analytics. Can be defined but is not displayed. Probably needs some Ex Libris advice and input. |
The short video, Conditional display of content on a dashboard page, shows how to use a condition to conditionally display analysis content on a dashboard page. So, as in the video, if the number of requests exceeds a certain number then do something, in this case, display that request count analysis.
Take some time to experiment with dashboard layout to get a good feel for what is possible.
Dashboard variables
The dashboard prompt
It is possible to create one or more dashboard prompts that ask the user of the dashboard to provide information relevant to running that dashboard and its content. Dashboard prompts store the prompted for values in variables which can be used by the analyses on a dashboard, or a dashboard page. This means that, for example, a date range could be prompted for. The values for this date range, the start and end, can be stored in two variables. Now we could have two, or more, analyses on the dashboard page, one reporting on physical loans, one reporting on acquisitions. Or any other aspect of library operations. Now the dates can be entered or changed and when "Apply" is clicked the analyses that use the variables created by the dashboard prompt are signalled that the variables have been modified and will update accordingly.
This is quite a powerful mechanism and is not restricted to providing date ranges. The variable could be used to adjust classmarks or fund names or anything else useful to an analysis. Input can be via text boxes, lists or radio buttons.
The video Construction of a dashboard prompt explores dashboard prompts for a date range.
Using the dashboard prompt
We have configured two variables in "DB_Date_Prompt" which was explored in The dashboard prompt. They are "DB_SDate" and "DB_Edate" representing the start date and end date of the range of dates that analyses will use on the dashboard. We reference these variables using the syntax "@{DB_SDate}" and "@{DB_EDate}".
In Making use of the dashboard prompts an interactive dashboard is explored. It uses "DB_Date_Prompt", as constructed in Construction of a dashboard prompt, and "DB_AppName_Prompt". The latter prompt is from in the "API Usage" subject area. It uses column prompt in that subject area to prompt for the name of an application that has been using the API. This name is stored in the variable "DB_AppName". Together "DB_SDate" and "DB_EDate", the three variables are used within the analysis, "api-usage" which is embedded in the dashboard. There is also a text dashboard object that displays the variables.
The main point to be taken from the video is that the dashboard prompts are used to update the value of variables. These variables can then be used in multiple dashboard analyses or objects to adjust the display or to filter the data in analyses, helping to provide an interactive experience.
Working with dashboards — final points
Dashboards provide a flexible mechanism for collecting disparate analyses and other components together into functional groups. The use of variables allows the different elements of a dashboard to "work together" to provide a cohesive and interactive view of a set of reporting components.
Exercises
-
Create your own dashboard prompt that creates three presentation variables, including default values, one for a date, one for a number, and one for a text field. Create a dashboard containing the prompt and with three text components with one of the variables displayed in each. Experiment and verify that this works as expected and that data validation is carried out, i.e. it’s not possible to enter text in the number field or the date field. Why can you put a number or date in the text field?